QuickFolders.org
| Home Installation Version History Premium Functions FAQ + Tips Support QuickFolders! Screenshots Bugs + Feature Requests Troubleshooting Menu On Top |
Troubleshooting
Github - why, and how?
Github is free and open to anyone who registers with it. The big advantage here is that many users can share bug information, or view feature requests or planned new features and track these, in true open source fashion. From time to time we will also publish patched prerelease versions by attaching them to their relevant bugs.
When submitting new bug reports, please search first whether the bug is already submitted to avoid yours being marked as duplicate.
No Software is without problems.
I try to publish software minimizing trouble for you but if you have some, I highly recommend to use Thunderbird's built in error console. Error console can be shown using the shortcut Ctrl+Shift+J or via the Thunderbird tools menu under Developer Tools &aq Error Console.
Console Configuration
-
Open Thunderbird Menu « Tools « Developer Tools « Error Console or hit the hotkeys Ctrl+Shift+J.
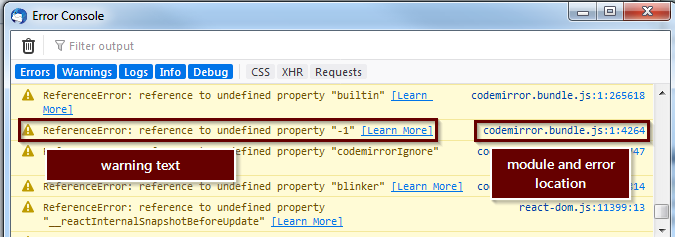
Set up the options to display Errors, Warnings and Logs:

To simplify reading the log, disable "show timestamps" and "group similar messages", QuickFolders keeps track of its own operations and will show the elapsed time since its last operation, so we can find out if something took a long time.

-
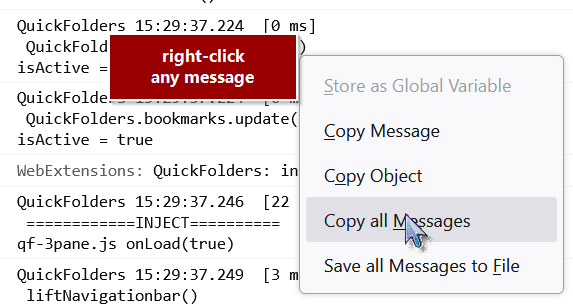
For optimal support You can use the right-click menu for copying the log information.
First choose select all and then the copy message item.

-
Often it is necessary to provide more context - you can tell QuickFolders to log more information of what it does.
-
Please activate the debug option on the bottom of QuickFolders ⇒ Advanced ⇒ Settings Tab:
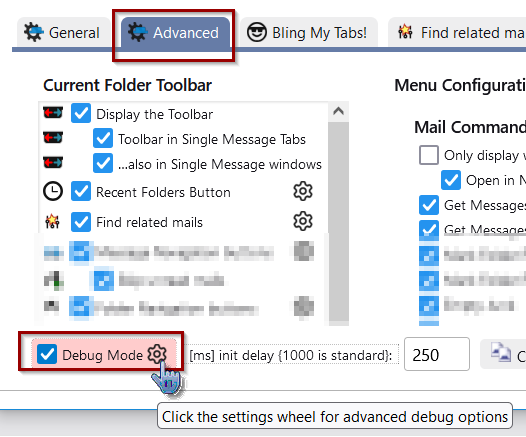
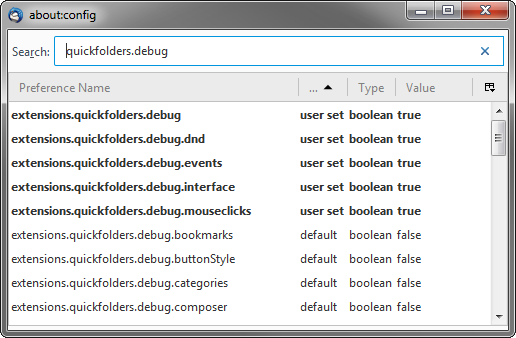
- You can create additional more specific messages by right-clicking the debug checkbox and activating additional
options(double click on the entry to toggle its active state).
Please do not activate everything as this will make the log unreadable also - if you send us a support email
I can usually advise which debug options to activate.
-
Please activate the debug option on the bottom of QuickFolders ⇒ Advanced ⇒ Settings Tab:
Analysing the Error Log
So once you have JS Error Console configured, what can you do it? Remember you have to always open the log window to start logging errors / activity so make sure you do this with Tools « Developer Tools « Error Console just before you do the trouble shooting.
STEP 1 - Set up the Investigation
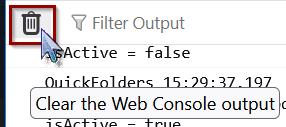
It is always preferred to click the "Clear" button at the top immediately before you reproduce the problem or carry out the actions you investigate. Also make sure to not repeatedly do your test steps once until the problem happens.
STEP 2 - Saving the Error Log
Then you need to copy the error log into a text file or email. Simply use the console window's
right-click menu and choose "Export Visible Messag To Clipboard / File ".
Do not take a screenshot of the error log as it is much
harder to investigate - text is nice as I can search and filter it!
You can always send me such error logs in an email if you are having problems.
A note on typical Error messages: If there is a problem somewhere in Thunderbird code or an Add-on, warnings and errors usually provide a location of where this happened. If the location starts with "chrome://" we know this happens in Thunderbird or and Add-on and not in a web page or within an email. Disabling Content is also helpful in filtering out such irrelevant lines. The line number is also very helpful in tracking down particular issues.
Any additional messages that QuickFolders generatess during "debug" logging typically look like this:
QuickFolders {EVENTS} 12:46:52.393  [0 ms]
clearChildren(withCategories= true)
 ----------
QuickFolders 12:46:52.530  [137 ms]
26 of 225 tabs rendered on toolbar.
 ----------
QuickFolders {INTERFACE} 12:46:52.530  [0 ms]
onTabSelected()
 folder = QF-bugs
All our debug logs start with the name of the add-on (QuickFolders). This can be followed by an optional {OPTION} which shows which additional area we are debugging. This is then followed by a time stamp (14:2:39.705) and a time measurement [0 ms] since our previous output. Underneath it may show additional information about what QuickFolders is doing at the moment.
Please copy the log text into a text file (just open notepad) and attach it to an email to support or to a Github Issue.
STEP 3 - Looking for Particular Problems
When you have completed the logging phase, you can now use the "Errors", "Warnings" and "Messages" buttons
to filter out particular problems. You can also use the Search box if you like, e.g. you could type a keyword
like "quickfolders":
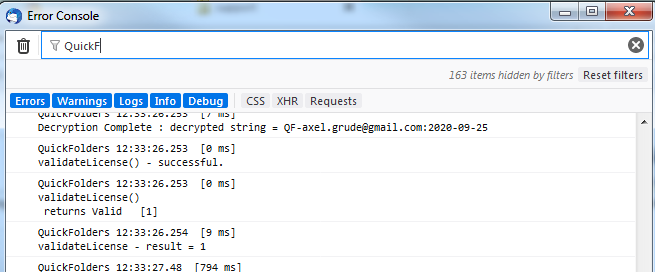
Note however this might actually hide the real cause of the problem so this is only for advanced users.
If you decide to send us a log, do not remove anything from it. To help me, just follow the
initial instructions and start with an empty log (only test one thing at a time).
Now you may see error entries or warnings inside Log Window listed like this:
